IR-Display Software
- Overview
- Specifications
- Collateral
- Videos
- Industries
- News
- Parts
Overview
- Enables remote control of Infrared Industries gas analyzers
- Works with FGA4500, FGA4000XDS, and HM5000 gas analyzers
- Displays HC, CO, CO2, O2, and NOx gases and tachometer, Lambda, AFR, pressure, and temperature
- Records and plays back data
- Plots and prints data
IR-Display is a Windows-based software program that allows remote control and display of the Infrared Industries FGA4000XDS, FGA4500, and HM5000 Gas Analyzers. IR-Display allows you to view, store, and plot data in addition to controlling the analyzer. The analyzer is connected via serial port to your computer.
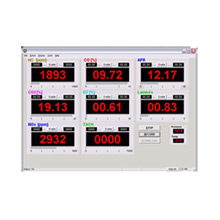
The main screen displays the currently measured values. These values consist of five gases: HC, CO, CO2, O2, and NOx (only on 5-gas analyzers), tachometer, Lambda, and Air to Fuel Ratio (AFR) as if you were reading the front panel of your analyzer.
All results are shown on one screen and they are in large numerals for readability. In addition, the pressure and temperature in the sample cell are displayed.
Setup is easy. You select the serial port, hook up the analyzer, and you are off and running. In addition, you can configure how frequently to record to a file and how often to refresh what's being measured on the screen.
In addition to viewing data digitally, you have the ability to plot the data on a graph. When displaying a graph, it is possible to select a plot of an individual gas or a combined graph of all data. The range of values for each gas to be displayed on the graph is configurable.
If you don't have a PC nearby at the time you are running a test, up to 30 minutes of data can be recorded and saved to the analyzer. Later you can download the data to your computer and play back the data through IR-Display.
IR-Display gives you the ability to show the values for each gas as either PPM units or percentage units and allows dynamic toggling between these different measurement units.
Selecting the Enable button makes it possible to track the minimum and maximum values being measured for each gas or other variable during a test or measurement session.
Multiple remote commands such as Pump ON/OFF, Zero, Reset, GPM Test, and Field Calibration can be initiated under the Action tab. These are all managed through the software, which gives you flexibility and ease of use.
IR-Display allows you to print the measurements. The printout can be customized with your logo and company information along with other job related information (i.e., work order numbers, vehicle information, notes, etc.). You can also customize which values you wish to have on the printout. The customer's printout can include a graph of the results of the emissions test.

The graph below shows several values plotted over a period of 80 seconds.

An emissions test usually runs around ten minutes. Select Record and the data is logged and can be saved to a comma separated file (.csv) and displayed in Excel or any program accept .csv formatted files. Not only is the volume of the gases being measured, but also the temperature and atmospheric pressure.
IR-Display Actions
- ZERO – Sets the zero point for all gases. Air or nitrogen must be present in the sample stream for the zero to perform correctly.
- GPM (Grams Per Mile) Test – Runs the Grams per Mile test
- PLAYBACK – Displays the stored data (from a file) on the screen
- RESET – Power cycles the analyzer
- FIELD CAL – Calibrates the analyzer with calibration gas to ensure proper readings
- VERSION – Displays the version of the software in the analyzer
- PUMP ON and PUMP OFF – Turns the pump on or off
- RECORD – When in Measure Mode, records data to a file
Specifications
| Remote Control of Gas Analyzers and Benches | |
|---|---|
| One analyzer | yes | Actions That Can Be Performed |
| Calibrate analyzer or bench with calibration gas | yes |
| Customize printout with your logo, company information, and other information | yes |
| Display gas values as PPM (parts per million) or percentage units and toggle between different measurement units | yes |
| Display values of five gases: HC, CO, CO2, O2, and NO | yes |
| Display values of tachometer, Lambda, Air to Fuel Ratio (AFR), and temperature | yes |
| Play back stored data from a file on the PC screen | yes |
| Plot data on a graph of an individual gas or a graph of all data | yes |
| Pump on and pump off from the software | yes |
| Record up to 30 minutes of data from the analyzer or bench to a csv file | yes |
| Reset (power cycle) the analyzer or bench | yes |
| Run GPM (Grams Per Mile) test | yes |
| Zero point can be set for all gases | yes |
Collateral
Videos
Select a Video:
- Connect Gas Analyzer to PCLength: 3:00
- How to Use IR-Display SoftwareLength: 8:22
- Downloading Data from an Infrared Industries Gas AnalyzerLength: 2:11
Industries
News
Parts
Template: single-product.php