IR-SmartView Software
- Overview
- Specifications
- Collateral
- Videos
- Industries
- News
- Parts
Overview
- Enables remote control of Infrared Industries gas analyzers and optical benches
- Works with any productized or custom Infrared Industries gas analyzers and optical benches
- Allows management of up to eight analyzers on one computer screen
- Measures, displays, records, and plays back data
- Plots and prints data
IR-SmartView Software is a Windows-based software program that allows remote control and display of up to eight Infrared Industries gas analyzers and optical benches. IR-SmartView Software allows you to view, store, and plot data in addition to controlling the analyzer. The analyzer is connected via serial port to your computer.
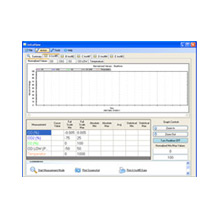
The main screen displays the currently measured values—gases and the temperature and pressure in the sample cell—on one screen as if you were reading the front panel of your analyzer. The software allows you to display up to nine gas measurements when connected to the IR-208 Gas Analyzer—up to six individual gases and dual curves for three gases.
Setup is easy. You select the serial port, hook up the analyzer, and you are off and running. You have the flexibility to configure and label which gases are to be displayed and to set global and analyzer-specific configurations. In addition, you can configure how frequently to record to a file and how often to refresh what’s being measured on the screen.
If you don’t have a PC nearby at the time you are running a test, up to 30 minutes of data can be recorded and saved to the analyzer. Later the data can be downloaded to your computer and played back through IR-SmartView Software.
When recording on the PC, a separate .csv file is automatically created for each analyzer for each recorded period of time. You can record a note that will alow you to add markers to the recorded data in the .csv file at any point in time.
When you select playback, the software automatically opens all the files under a period of time directory and displays the information for each analyzer in a table or graph on your computer screen.
In addition to viewing data digitally, you have the ability to plot the data on a graph. When displaying a graph, it is possible to select a plot of an individual gas or a combined graph of all data. The range of values for each gas to be displayed on the graph is configurable.
The software can be set to gather time-based statistics, which averages data over a user-specified period of time. These are displayed in the individual analyzer tabs.
You can turn real-time off after you have collected data and stopped measuring and then select a point on the graph—representing a point of time—and collapse or expand time slices on the graph.
As shown in the image above, each analyzer is displayed in its own tab and a digest of the activity in all analyzers feeding into the software is shown in a summary tab. The software allows you to select from a global list of what you want to display for each analyzer.
IR-SmartView Software gives you the ability to show the values for each gas as either PPM units or percentage units and allows dynamic toggling between these different measurement units.
Multiple remote commands such as Zero, Reset, Version, and Calibrate can be managed through the software, which gives you flexibility and ease of use.
You can choose a color to represent each measurement on the graph and table. You also have the ability to set alarm parameters for each analyzer so that if a gas exceeds those limits, the measurement will turn red on your software panel, bringing it to your attention.
IR-SmartView Software allows you to print the measurements. The printout can be customized with your logo, company information, and other information. You have the option to print a table and graph for an individual analyzer or to print a table that summarizes what is occurring in all of the connected analyzers.
Specifications
| Remote Control of Gas Analyzers and Benches | |
|---|---|
| Up to 8 gas analyzers and/or benches | yes |
| Actions That Can Be Performed | |
| Calibrate analyzer or bench with calibration gas | yes |
| Configure how frequently to record to a file and how often to refresh what’s being measured on the screen | yes |
| Configure what to display on the PC screen | yes |
| Customize printout with your logo, company information, and other information | yes |
| Display gas values as PPM (parts per million) or percentage units and toggle between different measurement units | yes |
| Display values of five gases: HC, CO, CO2, O2, and NO | yes |
| Display values of up to six individual gases and dual curves for three gases | yes |
| Gather time-based statistics for each individual analyzer or bench | yes |
| Play back stored data from a file on the PC screen | yes |
| Plot data on a graph of an individual gas or a graph of all data | yes |
| Pump on and pump off from the software | yes |
| Record up to 30 minutes of data from the analyzer or bench to a csv file | yes |
| Reset (power cycle) the analyzer or bench | yes |
| Set global configurations and analyzer-specific configurations | yes |
| Zero point can be set for all gases | yes |
Collateral
Videos
Select a Video:
Parts
Template: single-product.php